
Voting and participation
Highest participation
The MPs who have taken part in the most Commons divisions this Parliament.
| # | Member | Party | Constituency | Participation | Votes cast |
|---|---|---|---|---|---|
| 1 |  Rachel Hopkins Rachel Hopkins |
Labour | Luton South and South Bedfordshire | 95.8% | 551 of 575 eligible |
| 2 | Labour | Dunstable and Leighton Buzzard | 95.5% | 549 of 575 eligible | |
| 3 |  Christian Wakeford Christian Wakeford |
Labour | Bury South | 95.5% | 549 of 575 eligible |
| 4 |  Paul Davies Paul Davies |
Labour | Colne Valley | 94.3% | 542 of 575 eligible |
| 5 |  Steve Yemm Steve Yemm |
Labour | Mansfield | 94.1% | 541 of 575 eligible |
| 6 |  Callum Anderson Callum Anderson |
Labour | Buckingham and Bletchley | 93.9% | 540 of 575 eligible |
| 7 |  Sojan Joseph Sojan Joseph |
Labour | Ashford | 93.6% | 538 of 575 eligible |
| 8 |  Josh Dean Josh Dean |
Labour | Hertford and Stortford | 93.4% | 537 of 575 eligible |
| 9 |  Sean Woodcock Sean Woodcock |
Labour | Banbury | 93.4% | 537 of 575 eligible |
| 10 |  Gen Kitchen Gen Kitchen |
Labour | Wellingborough and Rushden | 93.2% | 536 of 575 eligible |
| 11 |  Tristan Osborne Tristan Osborne |
Labour | Chatham and Aylesford | 93.2% | 536 of 575 eligible |
| 12 |  Adam Thompson Adam Thompson |
Labour | Erewash | 92.9% | 534 of 575 eligible |
| 13 |  Liz Twist Liz Twist |
Labour | Blaydon and Consett | 92.5% | 532 of 575 eligible |
| 14 |  Peter Lamb Peter Lamb |
Labour | Crawley | 92.5% | 532 of 575 eligible |
| 15 |  Sir Mark Tami Sir Mark Tami |
Labour | Alyn and Deeside | 92.2% | 530 of 575 eligible |
| 16 |  Andrew Cooper Andrew Cooper |
Labour | Mid Cheshire | 91.8% | 528 of 575 eligible |
| 17 |  Rachael Maskell Rachael Maskell |
Labour (Co-op) | York Central | 91.7% | 527 of 575 eligible |
| 18 |  Chris Vince Chris Vince |
Labour (Co-op) | Harlow | 91.5% | 526 of 575 eligible |
| 19 |  Jack Abbott Jack Abbott |
Labour (Co-op) | Ipswich | 91.3% | 525 of 575 eligible |
| 20 |  Andy Slaughter Andy Slaughter |
Labour | Hammersmith and Chiswick | 91.1% | 524 of 575 eligible |
| 21 |  Deirdre Costigan Deirdre Costigan |
Labour | Ealing Southall | 91.1% | 524 of 575 eligible |
| 22 |  Jim Shannon Jim Shannon |
Democratic Unionist Party | Strangford | 91% | 523 of 575 eligible |
| 23 |  Matt Turmaine Matt Turmaine |
Labour | Watford | 91% | 523 of 575 eligible |
| 24 |  Harpreet Uppal Harpreet Uppal |
Labour | Huddersfield | 90.6% | 521 of 575 eligible |
| 25 |  Claire Hazelgrove Claire Hazelgrove |
Labour | Filton and Bradley Stoke | 90.1% | 518 of 575 eligible |
| 26 |  Gregor Poynton Gregor Poynton |
Labour | Livingston | 89.9% | 517 of 575 eligible |
| 27 | 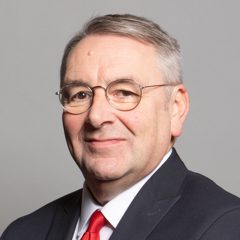 Sir Alan Campbell Sir Alan Campbell |
Labour | Tynemouth | 89.9% | 517 of 575 eligible |
| 28 |  Lola McEvoy Lola McEvoy |
Labour | Darlington | 89.7% | 516 of 575 eligible |
| 29 |  Claire Hughes Claire Hughes |
Labour | Bangor Aberconwy | 89.6% | 515 of 575 eligible |
| 30 |  Danny Beales Danny Beales |
Labour | Uxbridge and South Ruislip | 89.6% | 515 of 575 eligible |
| 31 |  Andrew Lewin Andrew Lewin |
Labour | Welwyn Hatfield | 89.4% | 514 of 575 eligible |
| 32 |  Kim Leadbeater Kim Leadbeater |
Labour | Spen Valley | 89.4% | 514 of 575 eligible |
| 33 |  Mark Ferguson Mark Ferguson |
Labour | Gateshead Central and Whickham | 89.4% | 514 of 575 eligible |
| 34 |  Jim Dickson Jim Dickson |
Labour | Dartford | 89.2% | 513 of 575 eligible |
| 35 |  Sam Carling Sam Carling |
Labour | North West Cambridgeshire | 89.2% | 513 of 575 eligible |
| 36 |  Will Stone Will Stone |
Labour | Swindon North | 89% | 512 of 575 eligible |
| 37 |  Lewis Atkinson Lewis Atkinson |
Labour | Sunderland Central | 88.9% | 511 of 575 eligible |
| 38 |  Michael Wheeler Michael Wheeler |
Labour | Worsley and Eccles | 88.9% | 511 of 575 eligible |
| 39 |  John Whitby John Whitby |
Labour | Derbyshire Dales | 88.7% | 510 of 575 eligible |
| 40 |  Paul Waugh Paul Waugh |
Labour (Co-op) | Rochdale | 88.7% | 510 of 575 eligible |
| 41 |  Tom Collins Tom Collins |
Labour | Worcester | 88.7% | 510 of 575 eligible |
| 42 |  Euan Stainbank Euan Stainbank |
Labour | Falkirk | 88.5% | 509 of 575 eligible |
| 43 |  Gurinder Singh Josan Gurinder Singh Josan |
Labour | Smethwick | 88.5% | 509 of 575 eligible |
| 44 |  Warinder Juss Warinder Juss |
Labour | Wolverhampton West | 88.5% | 509 of 575 eligible |
| 45 |  Lee Pitcher Lee Pitcher |
Labour | Doncaster East and the Isle of Axholme | 88.3% | 508 of 575 eligible |
| 46 |  Margaret Mullane Margaret Mullane |
Labour | Dagenham and Rainham | 88.3% | 508 of 575 eligible |
| 47 |  Ruth Jones Ruth Jones |
Labour | Newport West and Islwyn | 88.3% | 508 of 575 eligible |
| 48 |  Alan Strickland Alan Strickland |
Labour | Newton Aycliffe and Spennymoor | 88.2% | 507 of 575 eligible |
| 49 |  Douglas McAllister Douglas McAllister |
Labour | West Dunbartonshire | 88.2% | 507 of 575 eligible |
| 50 |  Emily Darlington Emily Darlington |
Labour | Milton Keynes Central | 88.2% | 507 of 575 eligible |
Excludes MPs recorded in fewer than 10 divisions, Sinn Féin MPs (who do not take their seats) and the Speaker.
These rankings are our own analysis of the official voting records (recorded votes only; they do not describe the formal whip). How we work this out.