
Voting and participation
Lowest participation
The MPs who have taken part in the fewest Commons divisions this Parliament.
| # | Member | Party | Constituency | Participation | Votes cast |
|---|---|---|---|---|---|
| 1 |  Caroline Nokes Caroline Nokes |
Conservative | Romsey and Southampton North | 0.2% | 1 of 575 eligible |
| 2 |  Judith Cummins Judith Cummins |
Labour | Bradford South | 0.2% | 1 of 575 eligible |
| 3 |  Ms Nusrat Ghani Ms Nusrat Ghani |
Conservative | Sussex Weald | 0.2% | 1 of 575 eligible |
| 4 |  Rishi Sunak Rishi Sunak |
Conservative | Richmond and Northallerton | 4% | 23 of 575 eligible |
| 5 |  Sir Keir Starmer Sir Keir Starmer |
Labour | Holborn and St Pancras | 6.8% | 39 of 575 eligible |
| 6 |  Sorcha Eastwood Sorcha Eastwood |
Alliance | Lagan Valley | 10.8% | 62 of 575 eligible |
| 7 |  Rachel Reeves Rachel Reeves |
Labour | Leeds West and Pudsey | 14.4% | 83 of 575 eligible |
| 8 |  Claire Hanna Claire Hanna |
Social Democratic & Labour Party | Belfast South and Mid Down | 20.3% | 117 of 575 eligible |
| 9 |  Mr David Lammy Mr David Lammy |
Labour | Tottenham | 20.7% | 119 of 575 eligible |
| 10 | 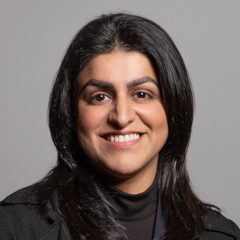 Shabana Mahmood Shabana Mahmood |
Labour | Birmingham Ladywood | 25.9% | 149 of 575 eligible |
| 11 |  Seamus Logan Seamus Logan |
Scottish National Party | Aberdeenshire North and Moray East | 26.4% | 152 of 575 eligible |
| 12 |  Chris Law Chris Law |
Scottish National Party | Dundee Central | 27.1% | 156 of 575 eligible |
| 13 |  Pete Wishart Pete Wishart |
Scottish National Party | Perth and Kinross-shire | 27.7% | 159 of 575 eligible |
| 14 |  Graham Leadbitter Graham Leadbitter |
Scottish National Party | Moray West, Nairn and Strathspey | 27.8% | 160 of 575 eligible |
| 15 |  Dave Doogan Dave Doogan |
Scottish National Party | Angus and Perthshire Glens | 28.9% | 166 of 575 eligible |
| 16 |  Kirsty Blackman Kirsty Blackman |
Scottish National Party | Aberdeen North | 28.9% | 166 of 575 eligible |
| 17 |  Dr Rosena Allin-Khan Dr Rosena Allin-Khan |
Labour | Tooting | 29% | 167 of 575 eligible |
| 18 |  Ed Miliband Ed Miliband |
Labour | Doncaster North | 29% | 167 of 575 eligible |
| 19 |  Rosie Duffield Rosie Duffield |
Independent | Canterbury | 29.4% | 169 of 575 eligible |
| 20 |  Yvette Cooper Yvette Cooper |
Labour | Pontefract, Castleford and Knottingley | 29.6% | 170 of 575 eligible |
| 21 | 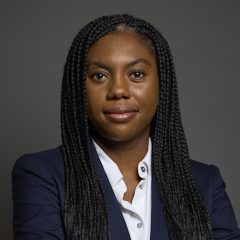 Mrs Kemi Badenoch Mrs Kemi Badenoch |
Conservative | North West Essex | 29.7% | 171 of 575 eligible |
| 22 |  Lisa Nandy Lisa Nandy |
Labour | Wigan | 29.9% | 172 of 575 eligible |
| 23 |  Brendan O'Hara Brendan O'Hara |
Scottish National Party | Argyll, Bute and South Lochaber | 30.4% | 175 of 575 eligible |
| 24 | Social Democratic & Labour Party | Foyle | 32% | 184 of 575 eligible | |
| 25 |  Rupert Lowe Rupert Lowe |
Restore Britain | Great Yarmouth | 33.2% | 191 of 575 eligible |
| 26 | 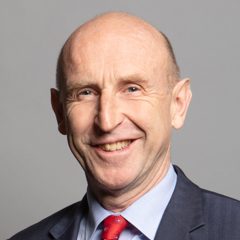 John Healey John Healey |
Labour | Rawmarsh and Conisbrough | 33.4% | 192 of 575 eligible |
| 27 |  Ayoub Khan Ayoub Khan |
Independent | Birmingham Perry Barr | 36.9% | 212 of 575 eligible |
| 28 |  Nick Thomas-Symonds Nick Thomas-Symonds |
Labour | Torfaen | 37% | 213 of 575 eligible |
| 29 |  Darren Jones Darren Jones |
Labour | Bristol North West | 38.4% | 221 of 575 eligible |
| 30 |  Suella Braverman Suella Braverman |
Reform UK | Fareham and Waterlooville | 38.6% | 222 of 575 eligible |
| 31 |  Dan Jarvis Dan Jarvis |
Labour | Barnsley North | 39.7% | 228 of 575 eligible |
| 32 |  Peter Kyle Peter Kyle |
Labour | Hove and Portslade | 39.7% | 228 of 575 eligible |
| 33 | 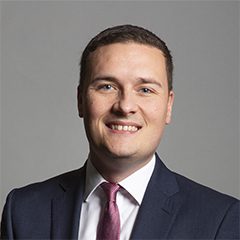 Wes Streeting Wes Streeting |
Labour | Ilford North | 40% | 230 of 575 eligible |
| 34 |  Karl Turner Karl Turner |
Independent | Kingston upon Hull East | 40.7% | 234 of 575 eligible |
| 35 |  Pat McFadden Pat McFadden |
Labour | Wolverhampton South East | 40.7% | 234 of 575 eligible |
| 36 |  Freddie van Mierlo Freddie van Mierlo |
Liberal Democrat | Henley and Thame | 40.9% | 235 of 575 eligible |
| 37 |  Sir Jeremy Hunt Sir Jeremy Hunt |
Conservative | Godalming and Ash | 40.9% | 235 of 575 eligible |
| 38 |  James McMurdock James McMurdock |
Independent | South Basildon and East Thurrock | 41.4% | 238 of 575 eligible |
| 39 |  Marsha De Cordova Marsha De Cordova |
Labour | Battersea | 41.4% | 238 of 575 eligible |
| 40 |  Sir Andrew Mitchell Sir Andrew Mitchell |
Conservative | Sutton Coldfield | 41.7% | 240 of 575 eligible |
| 41 |  Bridget Phillipson Bridget Phillipson |
Labour | Houghton and Sunderland South | 42.1% | 242 of 575 eligible |
| 42 |  Rachel Gilmour Rachel Gilmour |
Liberal Democrat | Tiverton and Minehead | 42.3% | 243 of 575 eligible |
| 43 |  Sir Geoffrey Cox Sir Geoffrey Cox |
Conservative | Torridge and Tavistock | 42.8% | 246 of 575 eligible |
| 44 |  Lara Bird Lara Bird |
Scottish National Party | Arbroath and Broughty Ferry | 42.9% | 12 of 28 eligible |
| 45 |  Robert Jenrick Robert Jenrick |
Reform UK | Newark | 43.3% | 249 of 575 eligible |
| 46 |  Alex Easton Alex Easton |
Independent | North Down | 43.7% | 251 of 575 eligible |
| 47 |  Sir Mark Hendrick Sir Mark Hendrick |
Labour (Co-op) | Preston | 44.5% | 256 of 575 eligible |
| 48 |  Steve Reed Steve Reed |
Labour (Co-op) | Streatham and Croydon North | 44.7% | 257 of 575 eligible |
| 49 |  Ed Davey Ed Davey |
Liberal Democrat | Kingston and Surbiton | 45.7% | 263 of 575 eligible |
| 50 | Labour | Paisley and Renfrewshire North | 45.9% | 264 of 575 eligible |
Excludes MPs recorded in fewer than 10 divisions, Sinn Féin MPs (who do not take their seats) and the Speaker. A low figure can reflect illness, maternity leave, a front-bench role elsewhere or a mid-term arrival, not just absence.
These rankings are our own analysis of the official voting records (recorded votes only; they do not describe the formal whip). How we work this out.