
Expenses and interests
Highest business costs
The MPs with the highest IPSA business-cost claims this Parliament.
| # | Member | Party | Constituency | Amount paid | Claims |
|---|---|---|---|---|---|
| 1 |  Stuart Andrew Stuart Andrew |
Conservative | Daventry | £385,772 | 172 claims |
| 2 | Social Democratic & Labour Party | Foyle | £375,513 | 121 claims | |
| 3 |  Brendan O'Hara Brendan O'Hara |
Scottish National Party | Argyll, Bute and South Lochaber | £373,630 | 259 claims |
| 4 |  Kate Osborne Kate Osborne |
Labour | Jarrow and Gateshead East | £367,387 | 197 claims |
| 5 |  John Lamont John Lamont |
Conservative | Berwickshire, Roxburgh and Selkirk | £367,008 | 346 claims |
| 6 |  Preet Kaur Gill Preet Kaur Gill |
Labour (Co-op) | Birmingham Edgbaston | £365,520 | 262 claims |
| 7 |  Chris Law Chris Law |
Scottish National Party | Dundee Central | £361,652 | 284 claims |
| 8 |  Jamie Stone Jamie Stone |
Liberal Democrat | Caithness, Sutherland and Easter Ross | £360,931 | 317 claims |
| 9 |  Dave Doogan Dave Doogan |
Scottish National Party | Angus and Perthshire Glens | £359,818 | 397 claims |
| 10 |  David Mundell David Mundell |
Conservative | Dumfriesshire, Clydesdale and Tweeddale | £359,460 | 495 claims |
| 11 | 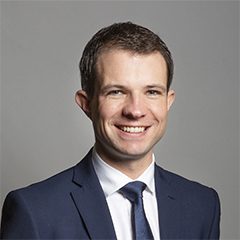 Andrew Bowie Andrew Bowie |
Conservative | West Aberdeenshire and Kincardine | £354,056 | 156 claims |
| 12 | 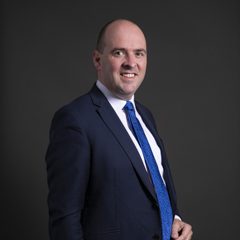 Mr Richard Holden Mr Richard Holden |
Conservative | Basildon and Billericay | £353,500 | 216 claims |
| 13 |  Alex Sobel Alex Sobel |
Labour (Co-op) | Leeds Central and Headingley | £352,455 | 183 claims |
| 14 |  Chris Elmore Chris Elmore |
Labour | Bridgend | £351,336 | 243 claims |
| 15 |  Christian Wakeford Christian Wakeford |
Labour | Bury South | £350,186 | 287 claims |
| 16 |  Tulip Siddiq Tulip Siddiq |
Labour | Hampstead and Highgate | £348,671 | 158 claims |
| 17 |  Liz Saville Roberts Liz Saville Roberts |
Plaid Cymru | Dwyfor Meirionnydd | £348,366 | 326 claims |
| 18 |  Alicia Kearns Alicia Kearns |
Conservative | Rutland and Stamford | £346,821 | 311 claims |
| 19 |  Stuart Anderson Stuart Anderson |
Conservative | South Shropshire | £344,176 | 287 claims |
| 20 | 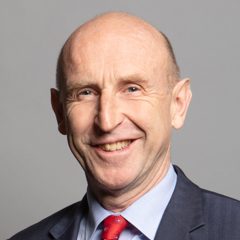 John Healey John Healey |
Labour | Rawmarsh and Conisbrough | £343,115 | 298 claims |
| 21 |  Liam Byrne Liam Byrne |
Labour | Birmingham Hodge Hill and Solihull North | £343,047 | 380 claims |
| 22 |  Esther McVey Esther McVey |
Conservative | Tatton | £341,750 | 265 claims |
| 23 |  Mr Alistair Carmichael Mr Alistair Carmichael |
Liberal Democrat | Orkney and Shetland | £341,665 | 333 claims |
| 24 |  Darren Jones Darren Jones |
Labour | Bristol North West | £339,591 | 172 claims |
| 25 |  Kirsty Blackman Kirsty Blackman |
Scottish National Party | Aberdeen North | £339,433 | 232 claims |
| 26 |  Simon Lightwood Simon Lightwood |
Labour (Co-op) | Wakefield and Rothwell | £338,859 | 203 claims |
| 27 |  Robert Jenrick Robert Jenrick |
Reform UK | Newark | £338,345 | 102 claims |
| 28 |  Alex Davies-Jones Alex Davies-Jones |
Labour | Pontypridd | £337,999 | 303 claims |
| 29 |  Paula Barker Paula Barker |
Labour | Liverpool Wavertree | £336,937 | 176 claims |
| 30 |  Christine Jardine Christine Jardine |
Liberal Democrat | Edinburgh West | £336,128 | 215 claims |
| 31 |  Tonia Antoniazzi Tonia Antoniazzi |
Labour | Gower | £335,996 | 198 claims |
| 32 |  Rushanara Ali Rushanara Ali |
Labour | Bethnal Green and Stepney | £335,964 | 116 claims |
| 33 |  Ashley Dalton Ashley Dalton |
Labour | West Lancashire | £335,933 | 131 claims |
| 34 |  Yasmin Qureshi Yasmin Qureshi |
Labour | Bolton South and Walkden | £335,868 | 177 claims |
| 35 |  Ian Lavery Ian Lavery |
Labour | Blyth and Ashington | £335,327 | 215 claims |
| 36 |  Dan Jarvis Dan Jarvis |
Labour | Barnsley North | £334,941 | 192 claims |
| 37 |  Dame Siobhain McDonagh Dame Siobhain McDonagh |
Labour | Mitcham and Morden | £334,297 | 184 claims |
| 38 |  Robbie Moore Robbie Moore |
Conservative | Keighley and Ilkley | £333,905 | 225 claims |
| 39 |  Graham Stuart Graham Stuart |
Conservative | Beverley and Holderness | £333,896 | 300 claims |
| 40 |  Judith Cummins Judith Cummins |
Labour | Bradford South | £333,007 | 251 claims |
| 41 |  Imran Hussain Imran Hussain |
Labour | Bradford East | £332,623 | 208 claims |
| 42 |  Wera Hobhouse Wera Hobhouse |
Liberal Democrat | Bath | £332,018 | 215 claims |
| 43 |  Bob Blackman Bob Blackman |
Conservative | Harrow East | £331,807 | 217 claims |
| 44 |  Gill Furniss Gill Furniss |
Labour | Sheffield Brightside and Hillsborough | £330,984 | 157 claims |
| 45 |  Jim Shannon Jim Shannon |
Democratic Unionist Party | Strangford | £329,359 | 205 claims |
| 46 |  Catherine McKinnell Catherine McKinnell |
Labour | Newcastle upon Tyne North | £329,146 | 160 claims |
| 47 |  Helen Morgan Helen Morgan |
Liberal Democrat | North Shropshire | £328,959 | 257 claims |
| 48 |  Mr Clive Betts Mr Clive Betts |
Labour | Sheffield South East | £328,778 | 340 claims |
| 49 |  Chris Webb Chris Webb |
Labour | Blackpool South | £328,575 | 254 claims |
| 50 |  Luke Pollard Luke Pollard |
Labour (Co-op) | Plymouth Sutton and Devonport | £327,652 | 315 claims |
IPSA claims paid for financial years from 2024/25 onwards. Most spending covers staff, office and travel costs, not personal income; London-area MPs claim less travel and accommodation by design.
These rankings are our own analysis of the official voting records (recorded votes only; they do not describe the formal whip). How we work this out.